Your backend exposes the same data through two auto-generated APIs — REST and GraphQL — and your frontend has to pick one. Most advice answers with ideology. We answered with a stopwatch, a byte counter, and the same five app screens fetched both ways.
On a backend that auto-generates both APIs, GraphQL vs REST performance is a property of request shapes — how many round trips a screen needs and how many bytes ride each one — not of the protocol name. The conceptual map lives in our GraphQL vs REST glossary entry; this post is the measured instance.
On November 3, 2026 we fetched five screens of a storefront admin from one live Back4app backend, through raw HTTP both ways, 100 paired runs per cell, under equivalence margins registered before any run. Wall time almost never moved. Bytes moved up to 6.5×. And one security answer diverged in a way no latency chart would catch.
Run it yourself: the lab is at github.com/templates-back4app/graphql-rest-lab — every number in this post is a script you can point at your own backend.
Which protocol should each screen speak, then?
For every screen both protocols could fetch in one request, pick on bytes and tooling — measured wall time would not separate them: every such pair sat within or astride our ±20 ms margin on a ~400 ms floor. GraphQL earned its keep on multi-entity screens, where its body was 6.5× smaller; elsewhere bytes tied or favored GraphQL by at most 1.7× once REST used keys= and include.
That sentence is the whole decision, so here is the table the rest of this post has to justify. All cells: live Back4app backend, Free plan, November 3, 2026; 100 paired runs per cell; bytes are decoded body bytes.
Verdicts use margins registered before the first run — a tie is only claimed inside a margin, and a gap our design could not resolve is reported as inconclusive, not rounded to a winner.
| Screen | Requests (GraphQL vs REST) | Decoded body bytes | Wall p50 verdict (±20 ms margin) | What actually decides it |
|---|---|---|---|---|
| Product detail (one object) | 1 vs 1 | 1,354 vs 1,430 — tie | 409 vs 397 ms — inconclusive | Nothing. Either works; GraphQL adds 244 B of query text upstream |
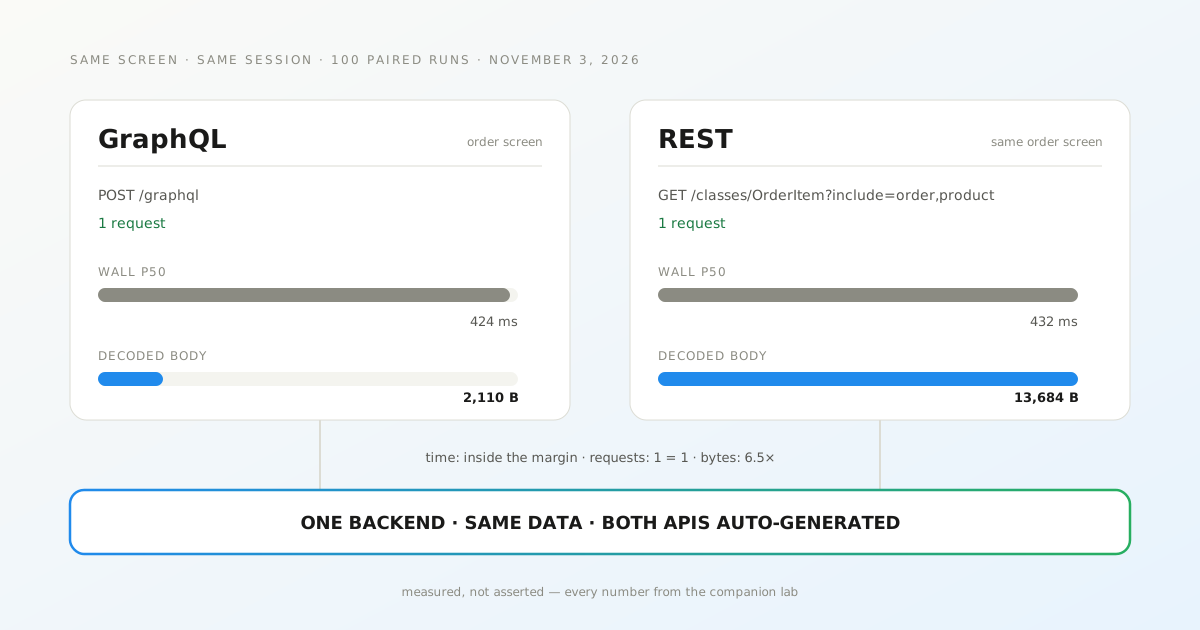
| Order screen (parent + 20 lines + count) | 1 vs 1 | 2,110 vs 13,684 — GraphQL, 6.5× | 424 vs 432 ms — inconclusive | Bytes: REST’s one-request shape repeats the parent in every line |
| Product list, 100 rows, 3 fields | 1 vs 1 | 9,453 vs 16,332 — GraphQL, 1.7× | 416 vs 416 ms — inconclusive | Both select fields; GraphQL also sheds the unrequested envelope |
| Page 10 of 1,000, cursor/offset known | 1 vs 1 | 13,529 vs 16,332 — GraphQL | 427 vs 424 ms — inconclusive | Neither: this cursor is an offset (verified below) |
| Walking pages 1→10 cumulatively | 10 vs 10 | 135,525 vs 163,968 — GraphQL | 4,523 vs 4,450 ms — REST by 40 ms | Round trips, which both pay identically |
| Mark an order shipped (write) | 1 vs 1 | 80 vs 40 — tie | 402 vs 399 ms — tie | Nothing. The write paths tie on every metric |
One number dwarfs the whole table and belongs to neither protocol: the naive order screen — fetch the order, fetch the items, then one request per product — executed 22 requests and took 8.9 s at p50 on the same backend.
REST’s include and GraphQL’s nesting each collapse it to one request at ~0.43 s. That anti-pattern is a request shape, and both protocols were measured against it, never condemned by it.
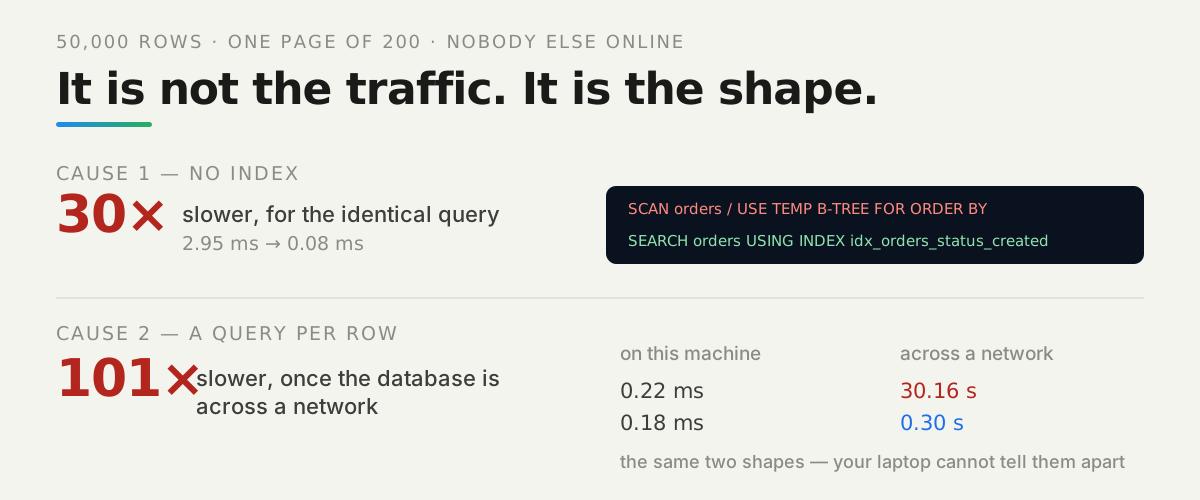
So the question “GraphQL or REST?” mostly dissolves into “one-request shapes or N-request shapes?” — the same mechanism we measured at 101× on a local database, now showing up as an API-protocol choice.
What remains protocol-specific is bytes on nested screens, the error convention, and one parity finding below that outranks every milliseconds column.
How did we measure, and what counts as a tie?
Short version: one live backend, both endpoints, raw HTTP with an instrumented Node client, 20 discarded warm-ups and 100 timed runs per cell, the two protocols alternating run by run. Every verdict is judged on the per-run paired difference.
The full methodology, harness and raw CSVs live in the lab repo; here is only what you need to read the tables.
The margins were fixed in code (scripts/lib/margins.mjs) before any measurement: wall time ±max(5 ms, 5% of the session’s own baseline p50) — ±19.97 ms this session; bytes ±max(200 B, 2%); request counts exact.
“Tie” is claimed only when the paired median and its spread sit inside the margin. Outside that, a gap bigger than the margin is a difference; anything else is inconclusive, reported as such.
Two byte figures appear in this post, labeled by what they are. “Decoded body bytes” is the JSON as your code sees it. “Wire bytes” are socket-attested transport deltas — status line, headers, framing and body, with identity encoding, so no compression is involved in either figure. Request counts are derived from executing the fixed screen code, never declared.
Drift control: the session’s first cell (the single-object REST shape) re-ran at the end — 399.37 ms p50 at open, 399.67 ms at close, within tolerance. All 1,700 timed runs completed with 0 errors; a GraphQL errors array on HTTP 200 would have counted as a failed run.
That ~400 ms baseline is this session’s measured floor, and it is the context for every latency verdict above: the network path dwarfs the protocol.
Was the GraphQL API even serving the same data as REST?
Yes — proven, not assumed, and nothing was timed until it was. The live GraphQL endpoint exists at https://parseapi.back4app.com/graphql and answered on the Free plan (verified November 3, 2026); no per-app enablement step was needed for the auto-generated schema to cover our custom classes, pointers, counts and cursors.
Before any timing, every screen’s two responses were normalized — ids, field order, row order where defined — and diffed. The gate for this run: all diffs empty, every scenario, including the write screen, where “equivalent” means both protocols leave the database in the same read-back state. One equivalence pass costs 73 HTTP requests, counted into the lab’s budget inventory.
That gate matters more than it looks. A benchmark comparing responses that are not the same data is comparing nothing; and the diff is also what caught the asymmetries worth writing about — the duplicated parent in REST’s include shape, and the count field each protocol delivers differently. The diff script and its output ship in the repo as evidence.
What happened when one user updated another user’s order?
The database refused both attempts — but only one API told the truth about it. Alice, a signed-in user, sent the same forbidden write both ways: update an order owned by Bob, a row her session cannot see. GraphQL answered with error code 101, Object not found. — the same refusal it gives a read. REST answered HTTP 200 with an updatedAt timestamp, and the row did not change.
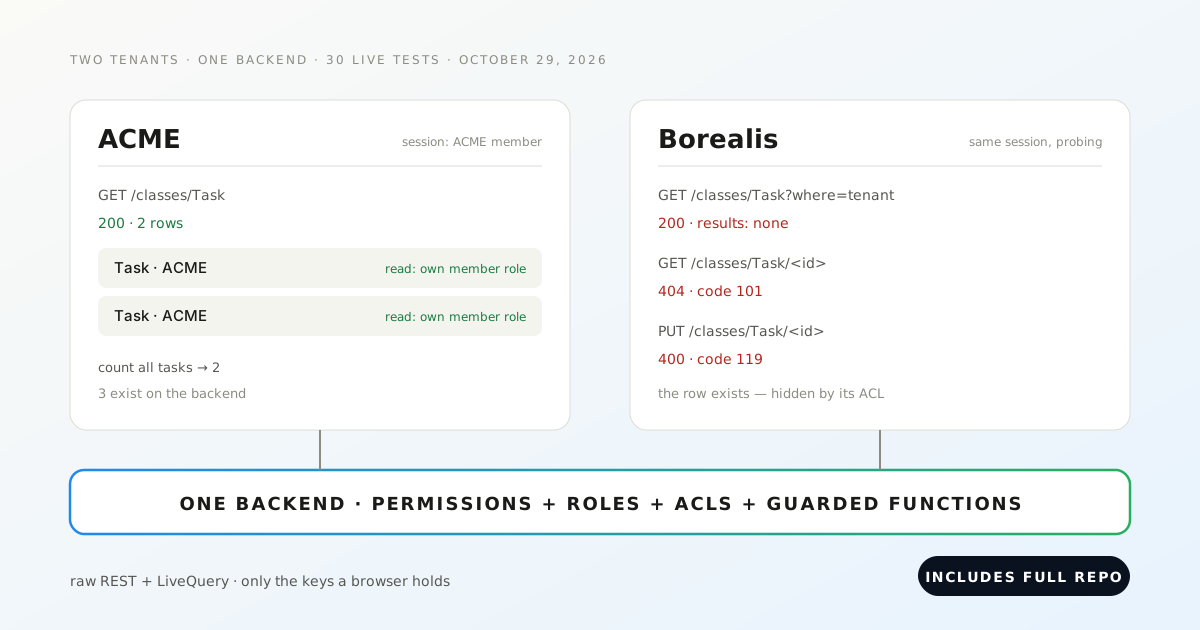
Read the finding precisely: the authorization held both times. Nothing was written and nothing leaked through either protocol — across all 28 parity requests, every forbidden read and write was refused and verified by state read-back, the same way we tested tenant isolation.
What diverged is the answer: one protocol refused loudly; the other reported success while writing nothing.
The two APIs enforced the same rule. They did not tell the same truth about it.
It is also a live-vs-local divergence, not just a protocol one. Against our local parse-server 7.5.4, the same REST request was refused outright — HTTP 404, {"code":101,"error":"Object not found."} — matching GraphQL. The live platform runs Parse Server 7.5.2; we did not identify the server-side cause, and we report the behavior, dated, without a mechanism claim.
Why it outranks the milliseconds: client code trusts 2xx. An optimistic UI, a retry queue, an offline sync layer — all of them will mark that write as done and never send it again. On this backend, as measured, a write’s only proof is reading the state back; our test suite’s one “failing” assertion is exactly this row, pinned to the local behavior so the divergence stays loud.
What does a single product cost through each API?
Whatever your app’s network path costs, plus almost nothing — and the protocols are indistinguishable. One product by id: REST 396.8 ms p50 / 474.4 ms p95; GraphQL 409.5 / 502.6. The paired median gap of 12.6 ms sits inside the ±20 ms margin but its spread does not, so the pre-registered verdict is inconclusive — not “GraphQL is 3% slower.”
Bytes genuinely tied: 1,430 decoded body bytes for REST, 1,354 for GraphQL, a 76 B gap inside the ±200 B margin. The direction worth knowing is upstream: GraphQL ships its query text — 244 bytes here — where REST’s GET sends an empty body, so GraphQL’s request wire cost was 594 B against REST’s 315 B. At this payload size the famous over-fetching argument has no material to work with.
How we measured: instrumented fetch over a kept-alive agent, socket byte counters, 100 paired runs alternating protocol, Free plan, USA East, November 3, 2026. That holds for every number in this post; per-cell CSVs are in the repo’s docs/evidence/.
How many requests does the order screen really need?
One — through either protocol, and we counted from executed code rather than declaring it. The screen shows an order, its 20 line items with product names, and the item count.
GraphQL does it in one POST whose document carries two root fields — there is no reverse collection on Order to traverse; the schema was checked, not assumed. REST does it in one GET on OrderItem with include=order,product.
# Stack: auto-generated GraphQL API, Parse Server 7.5.2 | File: scripts/lib/shapes.mjs (S2 document)
query OrderScreen($orderGid: ID!, $orderObjectId: ID!, $first: Int!) {
  order(id: $orderGid) { objectId number status totalCents placedAt customerName }
  orderItems(
    where: { order: { have: { objectId: { equalTo: $orderObjectId } } } }
    order: [objectId_ASC]
    first: $first
  ) {
    count
    edges { node { objectId qty unitCents product { name } } }
  }
}
# Stack: auto-generated REST API, Parse Server 7.5.2 | File: scripts/lib/shapes.mjs (S2, include1 shape)
curl -s -G "https://parseapi.back4app.com/classes/OrderItem" \
-H "X-Parse-Application-Id: $APP_ID" -H "X-Parse-REST-API-Key: $REST_KEY" \
-H "X-Parse-Session-Token: $SESSION" \
--data-urlencode 'where={"order":{"__type":"Pointer","className":"Order","objectId":"'$ORDER_ID'"}}' \
--data-urlencode 'order=objectId' --data-urlencode 'limit=100' --data-urlencode 'count=1' \
--data-urlencode 'include=order,product' \
--data-urlencode 'keys=qty,unitCents,order.number,order.status,order.totalCents,order.placedAt,order.customerName,product.name'Both shapes are fixed working code from the lab (scripts/lib/shapes.mjs), diff-verified to return the same data before timing. The REST shape works because this screen's order always has at least one item — the parent rides inside every line.
On wall time the two one-request shapes are inseparable: 423.7 ms p50 for GraphQL, 431.6 ms for REST, paired gap −8.5 ms, inconclusive. On bytes they are not: the REST response carries the parent order duplicated inside all 20 items — 13,684 decoded body bytes against GraphQL’s 2,110, a difference verdict by 11,574 B against a ±200 B margin.
REST also has a middle shape — one GET for the order plus one items query with include=product — which executed 2 requests, 805 ms p50, 7,061 B. Two round trips, two floors: the arithmetic is visible. The 22-request naive shape cost 8,918.9 ms p50 and 32,601 wire bytes down. The ladder is requests, not protocols — every rung exists on this one backend.
Does asking for fewer fields make the list faster?
It makes it smaller for both protocols, and measurably faster only when the payload was huge to begin with. A 100-row product list drawing three fields: full REST objects cost 143,549 decoded body bytes at 529.1 ms p50; REST with keys=name,sku,priceCents cost 16,332 B at 416.3 ms; GraphQL selecting the same fields cost 9,453 B at 415.6 ms.
So over-fetching is real and REST’s own keys= solves most of it — a 127 KB cut that came with ~113 ms at this payload size. Most GraphQL-vs-REST comparisons skip that cell; skipping it turns a shape problem into protocol ideology.
Between the two optimized cells the story repeats the whole post: bytes differ — 9,453 vs 16,332, a difference verdict, GraphQL shedding Parse’s per-object envelope fields that keys= cannot remove — while wall time is a dead heat, paired gap −1.1 ms, inconclusive at n=100 on a ~400 ms floor. Field selection is a bandwidth decision here, not a latency one.
Which pagination survives page ten?
Both — identically, because on this backend the GraphQL cursor is an offset. We decoded it rather than assuming keyset semantics: the auto-generated endCursor is base64 for arrayconnection:899 — the graphql-relay offset format — verified live and locally on November 3, 2026.
So a cursor API here is not evidence of keyset pagination, and every pagination claim in this section is scoped to this cursor implementation and our 1,000-row dataset.
The measurements agree with the decoding. Fetching page 10 with the position already known — REST skip=900, GraphQL after: the harvested cursor — cost one request either way: 423.7 vs 426.9 ms p50, inconclusive; 16,332 vs 13,529 body bytes, a modest GraphQL difference.
Page 1 behaved the same: 414.0 vs 422.2 ms, 16,332 vs 13,124 B. Every paginated query used a stable sort — sku ascending with objectId as the tie-breaker — so both protocols walked identical rows.
Walking pages 1→10 cumulatively — what a user scrolling actually does — cost 10 requests on both protocols and produced the session’s only wall-time difference verdict: REST 4,449.6 ms p50, GraphQL 4,523.4 ms, a 40.4 ms paired gap over ten round trips, with GraphQL 28,443 B lighter. Forty milliseconds against 4.5 seconds of accumulated floors: the mechanics tie, the round trips bill.
What does the GraphQL schema tell a stranger that REST never does?
Its shape. GraphQL has introspection and REST has no equivalent — and on the live backend, introspection answered an anonymous caller (app keys, no session) on November 3, 2026, revealing every custom class name: Product, Order, OrderItem, and even AuditLog, the master-key-only class no client can read. No row data leaked; the schema’s shape did.
The posture is the finding, because the default disagrees with it. Our local open-source parse-server 7.5.4 refuses the same query for non-master callers — HTTP 403, Introspection is not allowed — unless its public-introspection option is switched on. The live platform answered an ordinary key. We report the difference, dated, as a posture observation, not a vulnerability claim.
What to do with it: treat class and field names as public once the GraphQL endpoint is enabled, or keep secrets out of names. Data access itself held — the parity matrix shows anonymous and foreign reads refused both ways. But REST reveals schema only to the master key; GraphQL, here, reveals it to anyone the endpoint answers.
Which refusals will your client code actually see?
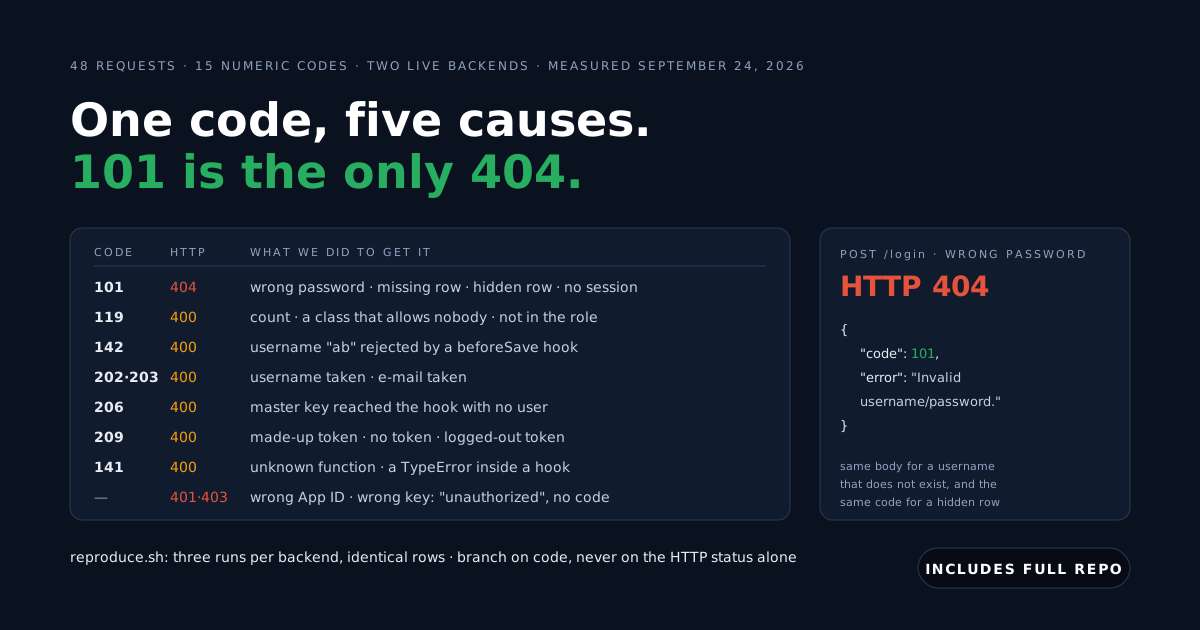
Different envelopes for the same refusal — worth knowing before you write error handling, because GraphQL delivers most errors on HTTP 200 while REST uses 4xx statuses. Same caller, same offense, recorded verbatim on November 3, 2026 (the codes are the standard Parse set — we cataloged them here):
101 Permission denied, user needs to be authenticated. — an anonymous find. REST: HTTP 404 with that JSON body. GraphQL: HTTP 200, the message inside the errors array with code: 101. A load balancer counting 5xx/4xx sees a healthy GraphQL API while every request fails.
101 Object not found. — reading (or updating, via GraphQL) a row your session cannot see. Deliberately identical to a nonexistent id on both protocols, so object ids are not an existence oracle. The REST update case is the phantom-success divergence above — the one row where the envelopes did not merely differ in dress.
119 Permission denied for action create on class Product. — a client write to a locked class. REST: HTTP 400. GraphQL: HTTP 200 with the error object. State read-back both times: zero intruder rows.
209 Invalid session token — a corrupted session, refused by REST as HTTP 400 with that body. This was the one refusal GraphQL also surfaced as a transport-level HTTP 400. Our harness treats any GraphQL errors array — even beside partial data — as a failed run; your client should too, because the status code usually will not tell you.
When is each protocol the wrong choice on this backend?
GraphQL is the wrong choice when URL-keyed HTTP caching is your win: every query POSTs to one endpoint, so shared caches and CDNs lose their key — the reasoning is in the glossary entry; we did not measure caching here and say so.
It is also one more schema, toolchain and error convention on your complexity budget; its introspection posture above is part of the deal; and if your app already uses the platform SDK — which speaks REST and batches include for you — most of the round-trip win is already yours.
REST is the wrong choice where our byte and round-trip numbers bite: screens assembled from several resources on high-latency links — the 8.9 s naive cell is the demonstration, and not every codebase’s include discipline survives the fifth developer.
It also loses on bandwidth-sensitive clients, where 2,110 B against 13,684 B per order screen compounds — and many differently-shaped clients sharing one API is the classic case for letting each declare its own selection.
Fit criteria only, and scoped: these are this backend’s auto-generated APIs, measured on November 3, 2026, on one dataset and one network path. Nothing here claims which protocol is faster in general — our data cannot say that, and neither can a chart from someone else’s backend.
What should you take to your own backend?
A method more than a verdict: fix the screens first, prove both APIs return the same data, register what “tie” means before measuring, and let request counts and state read-backs — not status codes and not ideology — decide.
On this backend the method returned: shapes decide latency, bytes reward GraphQL on nested screens, REST answers with keys= and include, and the one real divergence was an API answering 200 while writing nothing.
The graphql-rest-lab repo replays all of it against any Parse-compatible backend: the equivalence gate, the parity matrix with read-backs, the cursor decoder, and the paired measurement session with its pre-registered margins — seven steps, most of them unattended runs.
Run the lab on a free Back4app backend — the counted inventory for one full campaign is ≈14,900 HTTP requests, inside the Free plan’s 25K monthly quota (as listed on the pricing page, October 2026), and both APIs are there the moment the app exists.