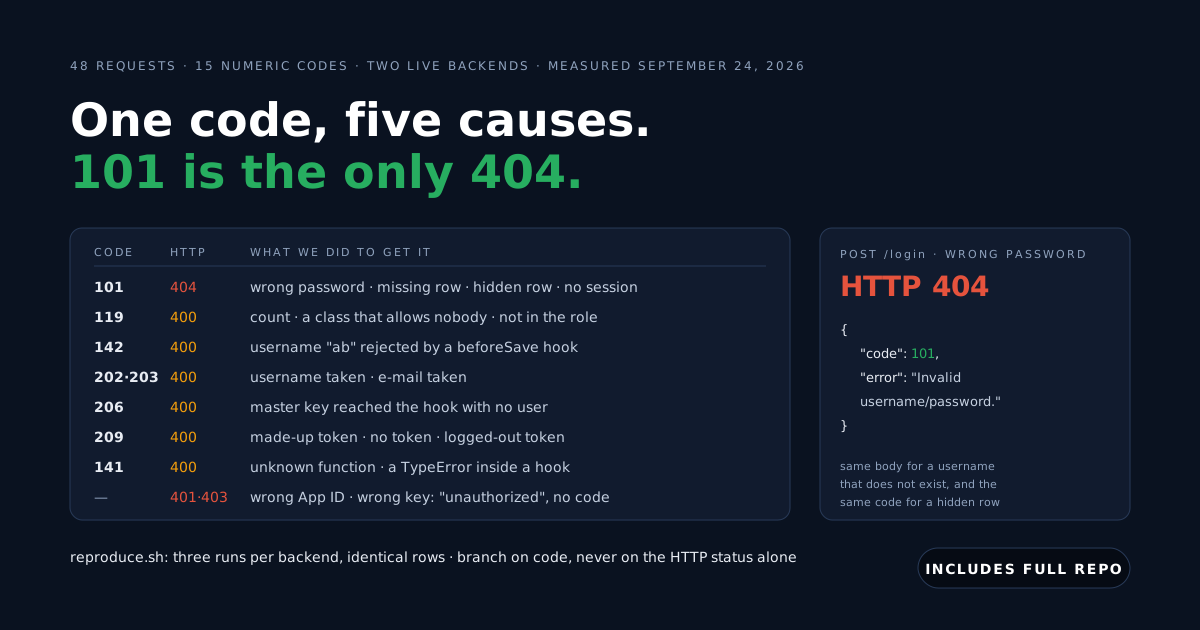
The reports are always the same shape. The database sits at 100% CPU with nobody online. The list view that was instant on your machine takes nine seconds for a colleague. Real-time features lag at eighty people.
It reads like a capacity problem, so the instinct is to buy a bigger machine. Usually it is not. It is two query shapes that cost nothing on your laptop and cost a great deal everywhere else.
This guide builds both of them against 50,000 rows, measures them, and asks the database to explain itself — so the cause is visible rather than asserted.
Watch it instead
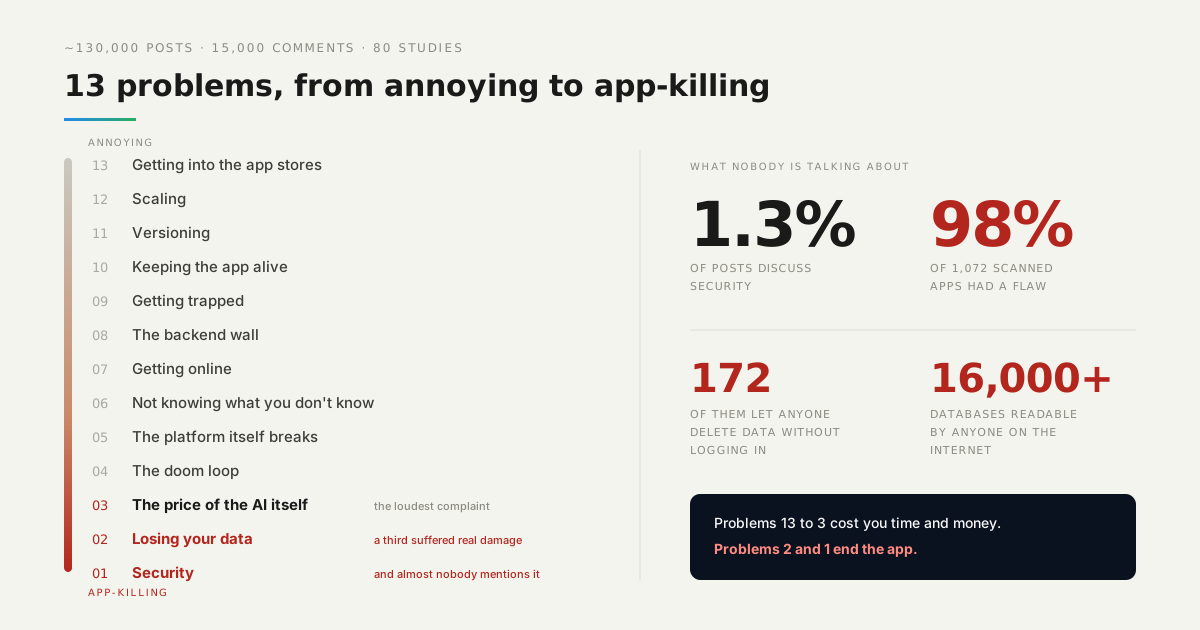
Scaling is number 12 in our countdown of what actually goes wrong for people building with AI.

Why does the CPU spike with nobody online?
Because one request can read the whole table. Load is requests multiplied by the work per request, and it is the second number that goes wrong first.
Here is the query behind an ordinary list view — the most recent 200 paid orders — run against 50,000 rows with nothing indexing the columns it uses:
SELECT id, total_cents, created_at FROM orders
WHERE status = ? AND created_at > ?
ORDER BY created_at DESC LIMIT 200;
It returns 200 rows. To find them it reads all 50,000, then sorts them in a temporary structure, and it does that again for every person who opens the screen.
You do not have to take that on faith. Every database will tell you what it is about to do:
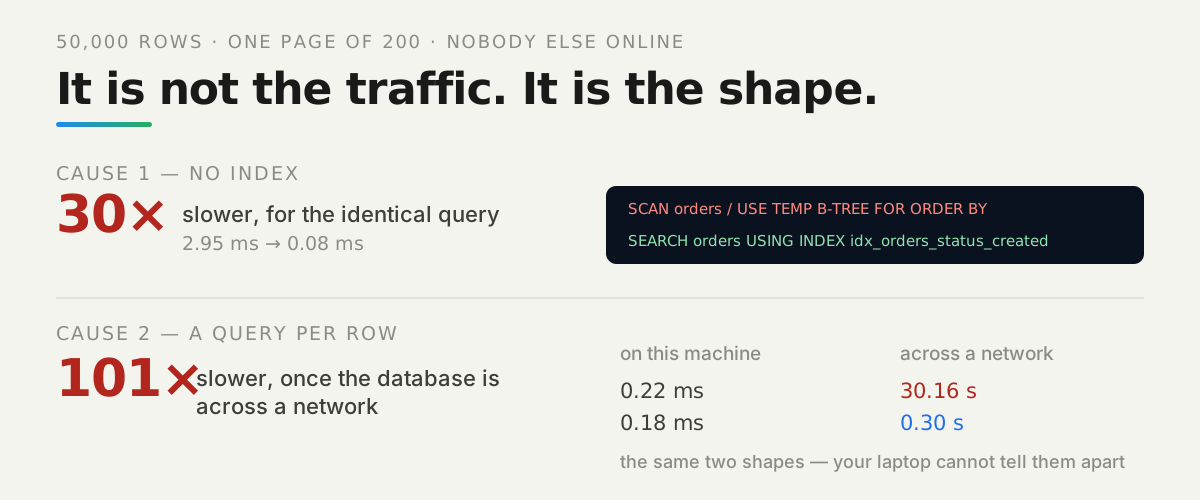
EXPLAIN QUERY PLAN → SCAN orders / USE TEMP B-TREE FOR ORDER BYSCAN is the whole table. USE TEMP B-TREE FOR ORDER BY is the sort it had to build because nothing was in the right order already.
What does one index actually change?
The plan, and then the time. One statement, covering the two columns the query filters and sorts by:
CREATE INDEX idx_orders_status_created ON orders (status, created_at DESC);The same query, unchanged, now reports:
EXPLAIN QUERY PLAN → SEARCH orders USING INDEX idx_orders_status_created (status=? AND created_at>?)| The same query | Time | What the database did |
|---|---|---|
| no index | 2.95 ms | SCAN orders + temporary sort |
| with the index | 0.08 ms | SEARCH orders USING INDEX |
About 30×, and the column order matters: the index covers status first and created_at second, which is the order the query uses them in.
How we measured: median of seven runs against 50,000 orders and 5,000 customers, each row carrying 300 characters of text so a row is realistic rather than three integers. Full script in the repo.
Why is the other problem invisible on your machine?
Because the thing it wastes is not computation. It is distance.
The pattern is a loop: fetch a page of orders, then look up each order’s customer one at a time. It is the most natural thing to write, and an AI assistant writes it constantly, because row by row is how the sentence describing it is shaped.
const orders = await db.all('SELECT id, customer_id FROM orders ... LIMIT 200');
for (const o of orders) {
  o.customer = await db.get('SELECT id, name FROM customers WHERE id = ?', o.customer_id);
}
That is 201 queries for one screen. Here is what it cost, in process, against the same 50,000 rows:
| Shape | Statements | Time |
|---|---|---|
| a query per row | 201 | 0.22 ms |
| the same page, two queries | 2 | 0.18 ms |
Which is to say: nothing. Your tests pass, the screen is instant, and there is no signal of any kind.
What does the same loop cost in production?
We measured a real round trip, because that is the thing a laptop does not have. From this machine to a hosted API, on a warm connection with the TLS handshake already paid, the median was 150 ms.
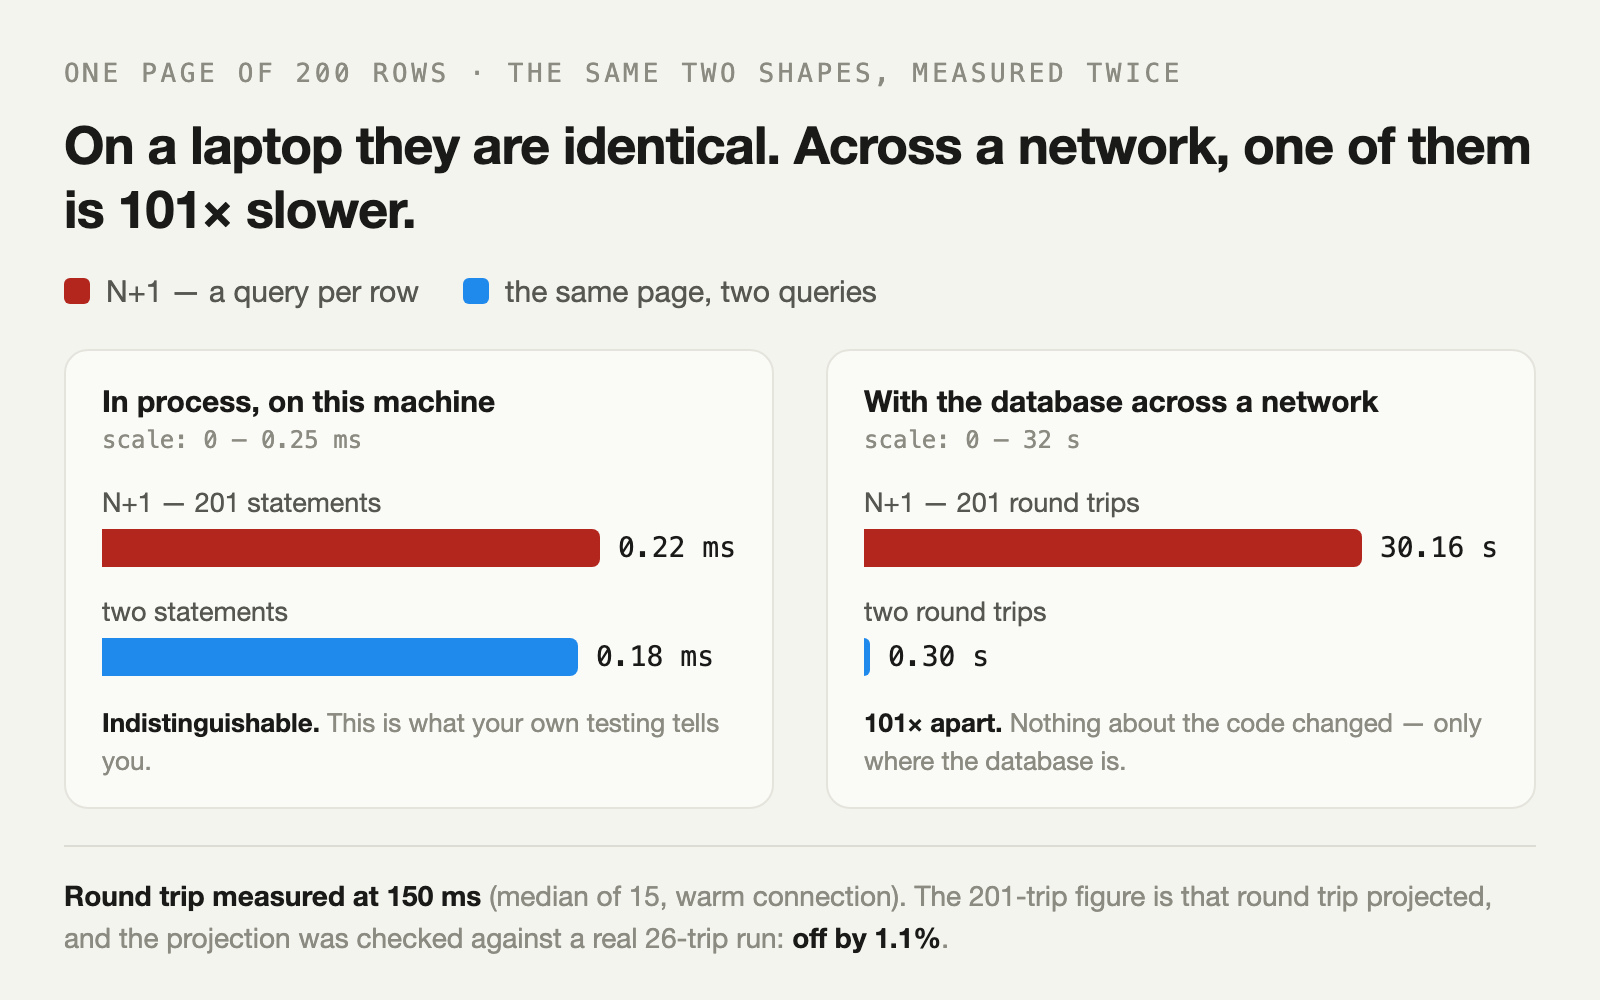
Then the arithmetic stops being arithmetic. 201 round trips is 30.16 s for one screen. Two round trips is 0.30 s. The same page, the same data, 101× apart.
We did not want to trust a multiplication, so we checked it: a real run of 26 sequential round trips took 3.94 s against a predicted 3.90 s — off by 1.1%. The projection holds.
The shape that destroys production is the one your own testing cannot feel.
How do you fix the loop?
Ask for the whole set once. Collect the ids you need, then make a single query that takes all of them.
const orders = await db.all('SELECT id, customer_id FROM orders ... LIMIT 200');
const ids = [...new Set(orders.map((o) => o.customer_id))];
const customers = await db.all(
  `SELECT id, name FROM customers WHERE id IN (${ids.map(() => '?').join(',')})`, ids);
const byId = new Map(customers.map((c) => [c.id, c]));
orders.forEach((o) => { o.customer = byId.get(o.customer_id); });
Two round trips instead of 201, and the deduplication matters: those 200 orders referred to fewer distinct customers, so the second query is smaller than the page.
On a backend that speaks REST or GraphQL the same move has a name. Ask for the related records in the query itself — an include on a pointer, or a nested selection — rather than fetching them one at a time from your own code.
Does the payload matter too?
It does, and it is the cheapest of the three to fix. We asked for every column, then for the two the screen draws:
| What we asked for | JSON returned |
|---|---|
SELECT * | 80,650 bytes |
id, total_cents | 6,102 bytes |
About 13× the bytes for the same 200 rows, paid on every request, by every user, and paid again on a phone with a weak signal. The culprit is usually one long text column nobody renders in a list.
When is it actually capacity?
When the plans are clean, the loops are gone, and it is still slow. That does happen, and it is a different conversation: more CPU, more memory, more connections.
The difference that matters is what fixing it costs you. Adding an index and collapsing a loop are changes inside one file. Outgrowing a machine should be a plan change, not a migration — which is the argument for not running the database yourself.
On a managed backend the servers, the patching and the connection limits are operated for you, so growth is a setting rather than a project. What stays yours is the shape of the query, and nothing can take that over, because only your code knows what the screen needs.
What should you check first?
The screen people complain about, and only that one. Find the query behind it and ask the database for its plan — EXPLAIN QUERY PLAN in SQLite, EXPLAIN ANALYZE in Postgres, the slow query log anywhere else.
If the plan says it is scanning, add the index for the columns in the WHERE and the ORDER BY, in that order, and read the plan again. If the plan is already clean, count your queries per request instead — a number that grows with the number of rows on screen is the loop.
Both answers are one line. Neither is a bigger machine, and you will not find either of them by testing on your own laptop, because on your own laptop they do not cost anything.