Debug Cloud Functions
After creating and developing your application using Parse Cloud Code functions, there’s always room for improvement when it comes to testing and debugging. This guide will show you how to integrate your code editor with Node.js to debug your functions using a local Parse Server instance, simulating the Back4app environment.
Goal
Enable you to debug your Parse Cloud Code locally in your preferred code editor.
1 - Preparing Your Project Files
If you are already hosting your application on Back4app or have set up Cloud Code via the dashboard, your project should follow this structure:
- cloud Directory: Contains the main.js file where your Cloud Code functions are defined.
- public Directory: Holds your static content such as HTML and JavaScript files, typically including an index.html file.
If your app is new or not yet deployed, replicate this structure to ensure the local Parse Server runs correctly.
2 - Running Your Parse Server Locally
To start a local instance of the Parse Server:
- Navigate to your project directory in the terminal.
- Run the following command to launch the server with a test database and your Cloud Code:
- Replace the placeholder values (YOUR_APP_ID, etc.) with random values. Avoid using your production keys.
- Verify that the server is running by opening http://localhost:1337/parse in your browser. An "unauthorized" error means the server is running but the request lacks authentication keys.
3 - Setting Up and Testing Cloud Code
Ensure all your Cloud Code functions are located in the cloud/main.js file. For example:
Parse.Cloud.define("debugTest", (request) => {
  return "Testing!";
});
Restart the Parse Server to load the new function:
Now, test the function using cURL in the terminal:
curl -X POST \
-H "X-Parse-Application-Id: YOUR_APP_ID" \
-H "X-Parse-Client-Key: YOUR_CLIENT_KEY" \
http://localhost:1337/parse/functions/debugTest
If configured correctly, the terminal will display the response "Testing!".
4- Debugging the Code with Node.js
You can use Node.js's debugging features, integrated with Visual Studio Code (or a similar IDE), to debug your functions step by step.
Setting up VS Code
- Open the Run and Debug panel on the left sidebar and click Create a launch.json file.
- Choose Node.js as the environment.
This creates a basic debug configuration. To enhance it:
- Click Add Configuration... and select Node.js: Attach to Process.
- Choose the Attach by Process ID action and attach it to the Parse Server's node process.
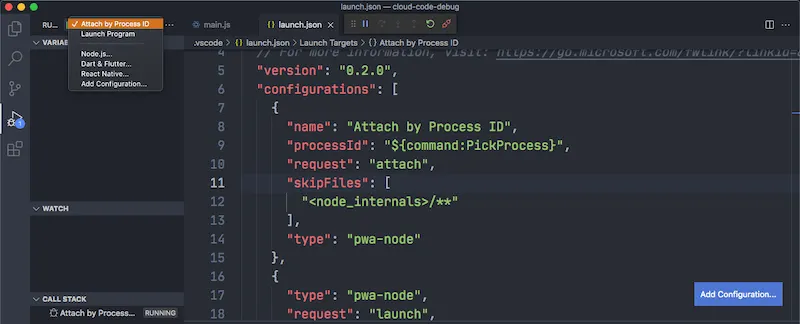
Debugging the Code
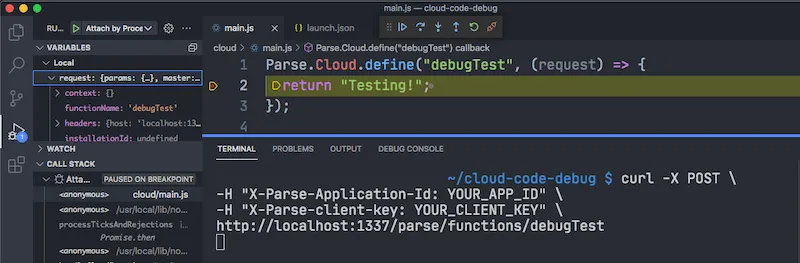
- Open main.js and set a breakpoint on the line return "Testing!"; by clicking to the left of the line number.
- Run the same cURL command as before. The debugger will pause execution at the breakpoint.
- While paused, inspect environment variable values and the call stack in the debugger panel.
This approach lets you analyze your code’s behavior in detail.
Conclusion
By following this guide, you’ll be able to debug all aspects of your Parse integration and Cloud Code functions locally, improving your development workflow with Back4app.